 Summary
- In recent sessions, we have seen increased selling in some of the most notable healthcare ETFs.
- Some key momentum indicators can be helpful in determining the current state of a respective trend.
- We provide a basic overview of how to apply some of the more commonly used momentum indicators in an attempt to illustrate what investors can expect from healthcare ETFs.
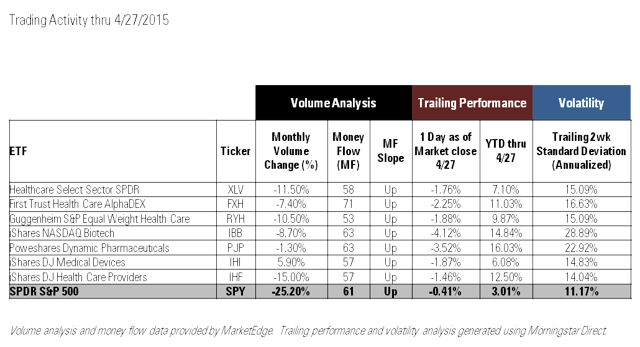
In a number of our previously published articles (including The Beginning Of The End, as well as in Choosing The Right Healthcare ETF) we have made mention of the relatively dramatic outperformance we have seen in the healthcare sector year to date, as well as in recent years. In recent weeks, we have begun to see increased selling pressure in this segment of the market. On April 27th, when the S&P 500 closed down -0.41% on the day, a number of leading healthcare ETFs faired far worse:
- Health Care Select SPDR (TICKER: XLV): -1.76%
- First Trust Health Care AlphaDEX (TICKER: FXH): -2.25%
- Guggenheim S&P Equal Weight Health Care (TICKER: RYH): -1.88%
- iShares NASDAQ Biotech (TICKER: IBB): -4.12%
- PowerShares Dynamic Pharmaceuticals (TICKER: PJP): -3.52%
- iShares U.S. Medical Devices (TICKER: IHI): -1.87%
- iShares U.S. HealthCare Providers (TICKER: IHF): -1.46%
Such glaring divergences in performance among the leading healthcare ETFs and the broader markets, on a day in which there were no market moving headlines in the healthcare space, should lead investors to question whether we are simply seeing some profit taking, or whether we are witnessing the beginning of a longer-term trend reversal.
While there is certainly no clear-cut singular metric that can be used to answer this question, we believe there are a handful of useful indicators that can prove to be useful and provide us with a better understanding as to the state of the current trend and the likeliness of whether or not that trend will continue.
Volume Analysis
One useful means for determining the current state of a given trend is through volume analysis. Specifically, one should begin by looking at whether volume over recent periods is either increasing or decreasing over the prior period. One should then put this into the context of how this compares to the broader benchmark index.

Another useful metric for gauging the stage of a current trend is by using the Money Flow Index. The Money Flow Index is a momentum indicator that uses a stock’s price and volume to predict the reliability of current trends. This index tracks the flow of money into or out of a security over a trailing 14-day period. Readings below 20 indicate a security is Oversold, indicative of a short-term bullish condition, while levels above 80 suggest an Overbought short-term bearish condition.
While the Money Flow Index can certainly serve as a useful tool in determining the current state of a given trend, one should also consider the slope of the index. The direction of the slope serves as an indicator that forewarns of a change in the trend of a security.
Volatility
Historically, studies have shown that there is a strong relationship between volatility and market performance. Volatility has a tendency to decline as the stock market rises and increase when the stock market falls. Therefore, when we see volatility increase we should recognize that risks in the market or in a given security are also increasing and there is a greater likelihood for decreased returns. When analyzing a specific ETF we find it helpful to also consider the long-term relationship versus the broader markets, in comparison to what we are seeing in more recent trading sessions.
Now that we have laid out some basic criteria for assessing the state of current trends, let’s take a look at how this applies to the recent price action we are seeing in the healthcare sector of the market:
In all but one sub-sector of healthcare (medical devices) we can clearly see that month over month volume has decreased. However, whereas there has been a 25% decrease in volume in the SPDR S&P 500 ETF (TICKER: SPY), the decreases we are seeing in healthcare are considerably less. So from a broader perspective, volume across the market has decreased over the trailing one month, but less so for healthcare. We view this as a positive sign as healthcare has proven to be more resilient.
As far as the Money Flow Index is concerned, across the board none of the respective healthcare ETFs cited in this article reflect an Overbought condition (which would indicate a stronger likelihood for near term bearish price action). At the same time, these ETFs are certainly closer to Overbought than they are Oversold (as measured by a reading of 20 or less).
The Money Flow Slope remains up, indicating that despite recent selling, over the trailing 14-day period they are still moving closer to an Overbought condition (though not dangerously close at this stage). This indicates to us that should overall market conditions remain favorable, healthcare ETFs still have some room to run.
Taking a look at the trailing 2-week standard deviation and annualizing these numbers we can clearly see that each of the healthcare ETFs cited have been more volatile than the S&P 500 itself over this period. Outside of the biotech space, healthcare as a whole is generally a sector that is less volatile than the market, so we do think this is something to pay attention to.
While no one can say for sure the immediate direction of the healthcare sector, or of the broader market in general, taking a look at some of the more reliable momentum indicators leads us to believe that the recent divergences we have seen between the price action of notable healthcare ETFs and the S&P 500 are likely evidence of profit taking more than anything else. This makes sense when you take into consideration that year to date some of these healthcare ETFs are up more than 13% more than the S&P 500. With that said, should healthcare to continue to outperform in coming weeks, we will move closer and closer to a more meaningful and necessary short-term contraction versus other sectors and the broader markets. These reversions and rotations are common and should be viewed as healthy for market participants, providing better entry points for those investors employing a more opportunistic approach.
Date: April 29, 2015